
Context
An international e-commerce company sources sales, stock, and order statuses from multiple channels: online storefronts, accounting systems, warehouse platforms, OMS, WMS, and user reports. For business, it's one process: items must show in stock, orders must pass to OMS, shipments must get correct status, and managers must see sales in BI with accurate date, time, and geography.
In practice, such loops break not from one major failure but from many small discrepancies. A sale recorded after midnight in local time might appear in the previous day's report. A file with sales and stock may fail to upload, but users see unclear errors and don't know what to fix. Shipment integration sends warnings that must be distinguished from true process stoppers. Result: lost business confidence in data and wasted time on manual troubleshooting.
Challenge
Business task: make the sales, stock, and OMS loop manageable so teams see accurate data, understand error causes, and can quickly distinguish normal variance from issues affecting orders or reporting.
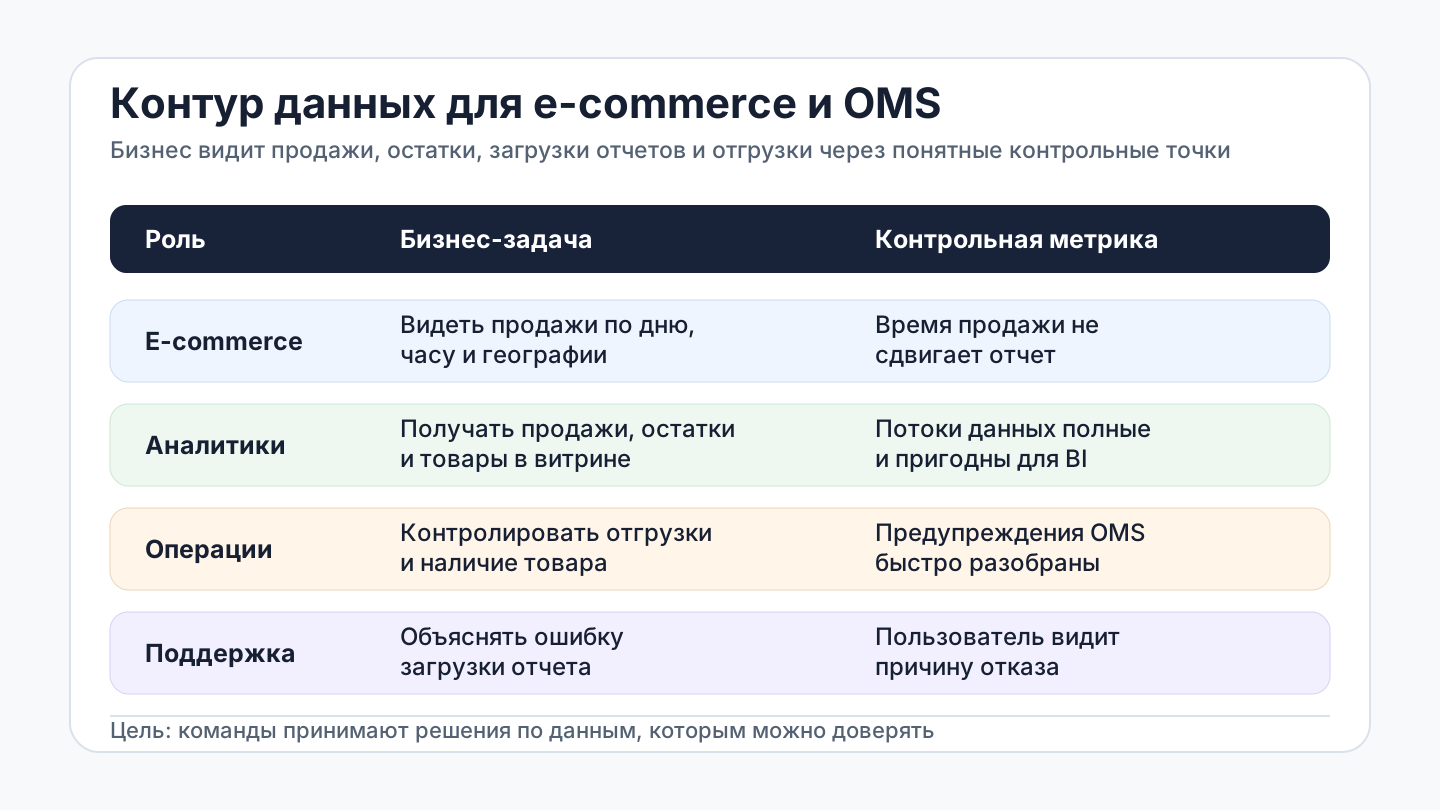
Different roles had different needs: e-commerce manager sees sales by day, hour, and geography without timezone shifts; analysts get sales, stock, and items in reporting-ready database form; operations team understands if shipments passed to OMS and order risk; report uploaders see specific rejection reasons; OMS support quickly identifies the problem source.
Review a similar project with an architect
Solution
The team broke the loop into business checkpoints: sale time, data warehouse completeness, user report loads, shipment statuses, and OMS scenario availability. This approach shifted focus from isolated technical tickets to a unified data path from sale to management report.
- We prepared the data warehouse infrastructure foundation and loaded key entities: sales, stock, and items from multiple sources.
- We reviewed what data analysts already had and identified sources where timezone and geography rules needed clarification.
- We established a business rule for sale time: reporting uses fiscal registration time and the geography's local time, not random server offsets.
- We clarified source-specific rules so each data flow knew where to get the timezone and how it should map to BI.
- To improve report uploads, we expanded the template with VAT rate field and auto-calculate tax amount if users enter rate but not amount.
- We strengthened upload diagnostics: errors must show which sheet and rows failed validation, not leave users with generic messages.
- For OMS and shipments, we identified control events: integration alerts, user access, WMS stock availability, and user scenario availability in the partner portal.
Metrics and business goals
In such projects, what matters is not task count but business confidence in data and response speed to failures. Metrics must align with roles and the decisions they make.
Business goal: e-commerce manager trusts sales reports, analysts don't rebuild data manually, operations team doesn't miss shipping issues, and support quickly identifies error sources.
- accuracy of sale date and time in BI by geography;
- share of sources with established timezone rules;
- completeness of 'sales-stock-items' flows in the analytics database;
- share of report uploads where users see clear rejection reasons;
- time to diagnose report upload errors;
- number of repeated alerts on OMS shipment transfers;
- availability of key OMS scenarios and partner portal for the operations team.
Result
The project achieved better control over sales, stock, and OMS data. Sales, stock, and items were loaded into the data warehouse as the analytics foundation. For the contentious question of sale time, we established: reporting must use fiscal event time and the geography's local time, not random server offsets. Report uploads gained clearer template improvements and diagnostics that reduce manual troubleshooting with users.
For business, this means not 'another integration' but better control of e-commerce operations. Teams get clear checkpoints: where to verify data completeness, how to interpret sale time, why a report didn't load, what's happening with shipments, and where action is needed.