











Solutions

ESB/iPaaS Integration Cost by Flows

Specify the infrastructure, systems, and entities to exchange. The calculator will show the cost of access, connection analysis, and real-time load.

Our clients

Clients and partners

Capital Group
FSK Group
SMLT
Tochno
Dogma
Sber City
FM Logistic
Danone
Relief Center
Pandora
ESB/iPaaS Integration Cost Calculator
Saint-Gobain
Askona
FIX PRICE
Snezhnaia Koroleva
Muztorg
TVOE
Greenway
Polaris
Campari
Yandex
Lenta
International perfume and cosmetics brand
ESB/iPaaS Integration Cost Calculator
RAEC
EKF
L'Etoile
Inventive Retail Group

Integrations

Change one system without rewriting the rest

The integration layer cures four ailments of rigid data exchange: data loss, cascading rework, source overload and inconsistency. ESB, Kafka and n8n solve different problems.

50flows in 6 months — a speed benchmark for an ESB project
48flows in production with a target loosely coupled architecture
16xfaster launch of standard integrations compared to code

ESB

Routing, transformation, guaranteed delivery and low-code support of legacy exchanges.

Kafka

Durable log: an event is stored, re-read, multiple consumers read at their own pace.

n8n

Fast orchestration of a process and AI steps where heavy event streaming isn't needed.

sourcedata contractESB/Kafka/n8nmonitoringconsumers
200+enterprise flows in production across different tools
50flows in 6 months for a retail holding company, from requirements to operations
up to 16xfaster to build integration through a bus than point-to-point in code
13 yearswe build integrations for mid-sized and large businesses

Preliminary budget

Estimate integration flow costs

Specify the infrastructure and systems, then set up exchange with each system. All rates are visible, and the total recalculates instantly.

How the calculation works

A separate calculation block appears for each system. It specifies the data to be transferred and the work required before the exchange goes live.

Fixed rates

  • new flow - 10,000 RUB
  • server - 30,000 RUB
  • access - 40,000 RUB per system
  • Requirements - 10,000 RUB
  • connection analysis - 10,000 RUB
  • Entity - 10,000 RUB
  • Real-time or high load - 40,000 RUB

1. Server and systems

A separate settings block will appear for each system below. There is no separate charge for the number of systems itself.

2. Configure integration for each system

Name the system, specify the number of entities, and select the required work.

System 1 1 · 20 000 ₽

The bus keeps systems from needing to know about each other

  1. Every direct integration ties together the release cycles of two systems: update one, and you have to revise the other.

  2. With ten systems, that is up to 45 pairwise links, and any one of them can break with the next release.

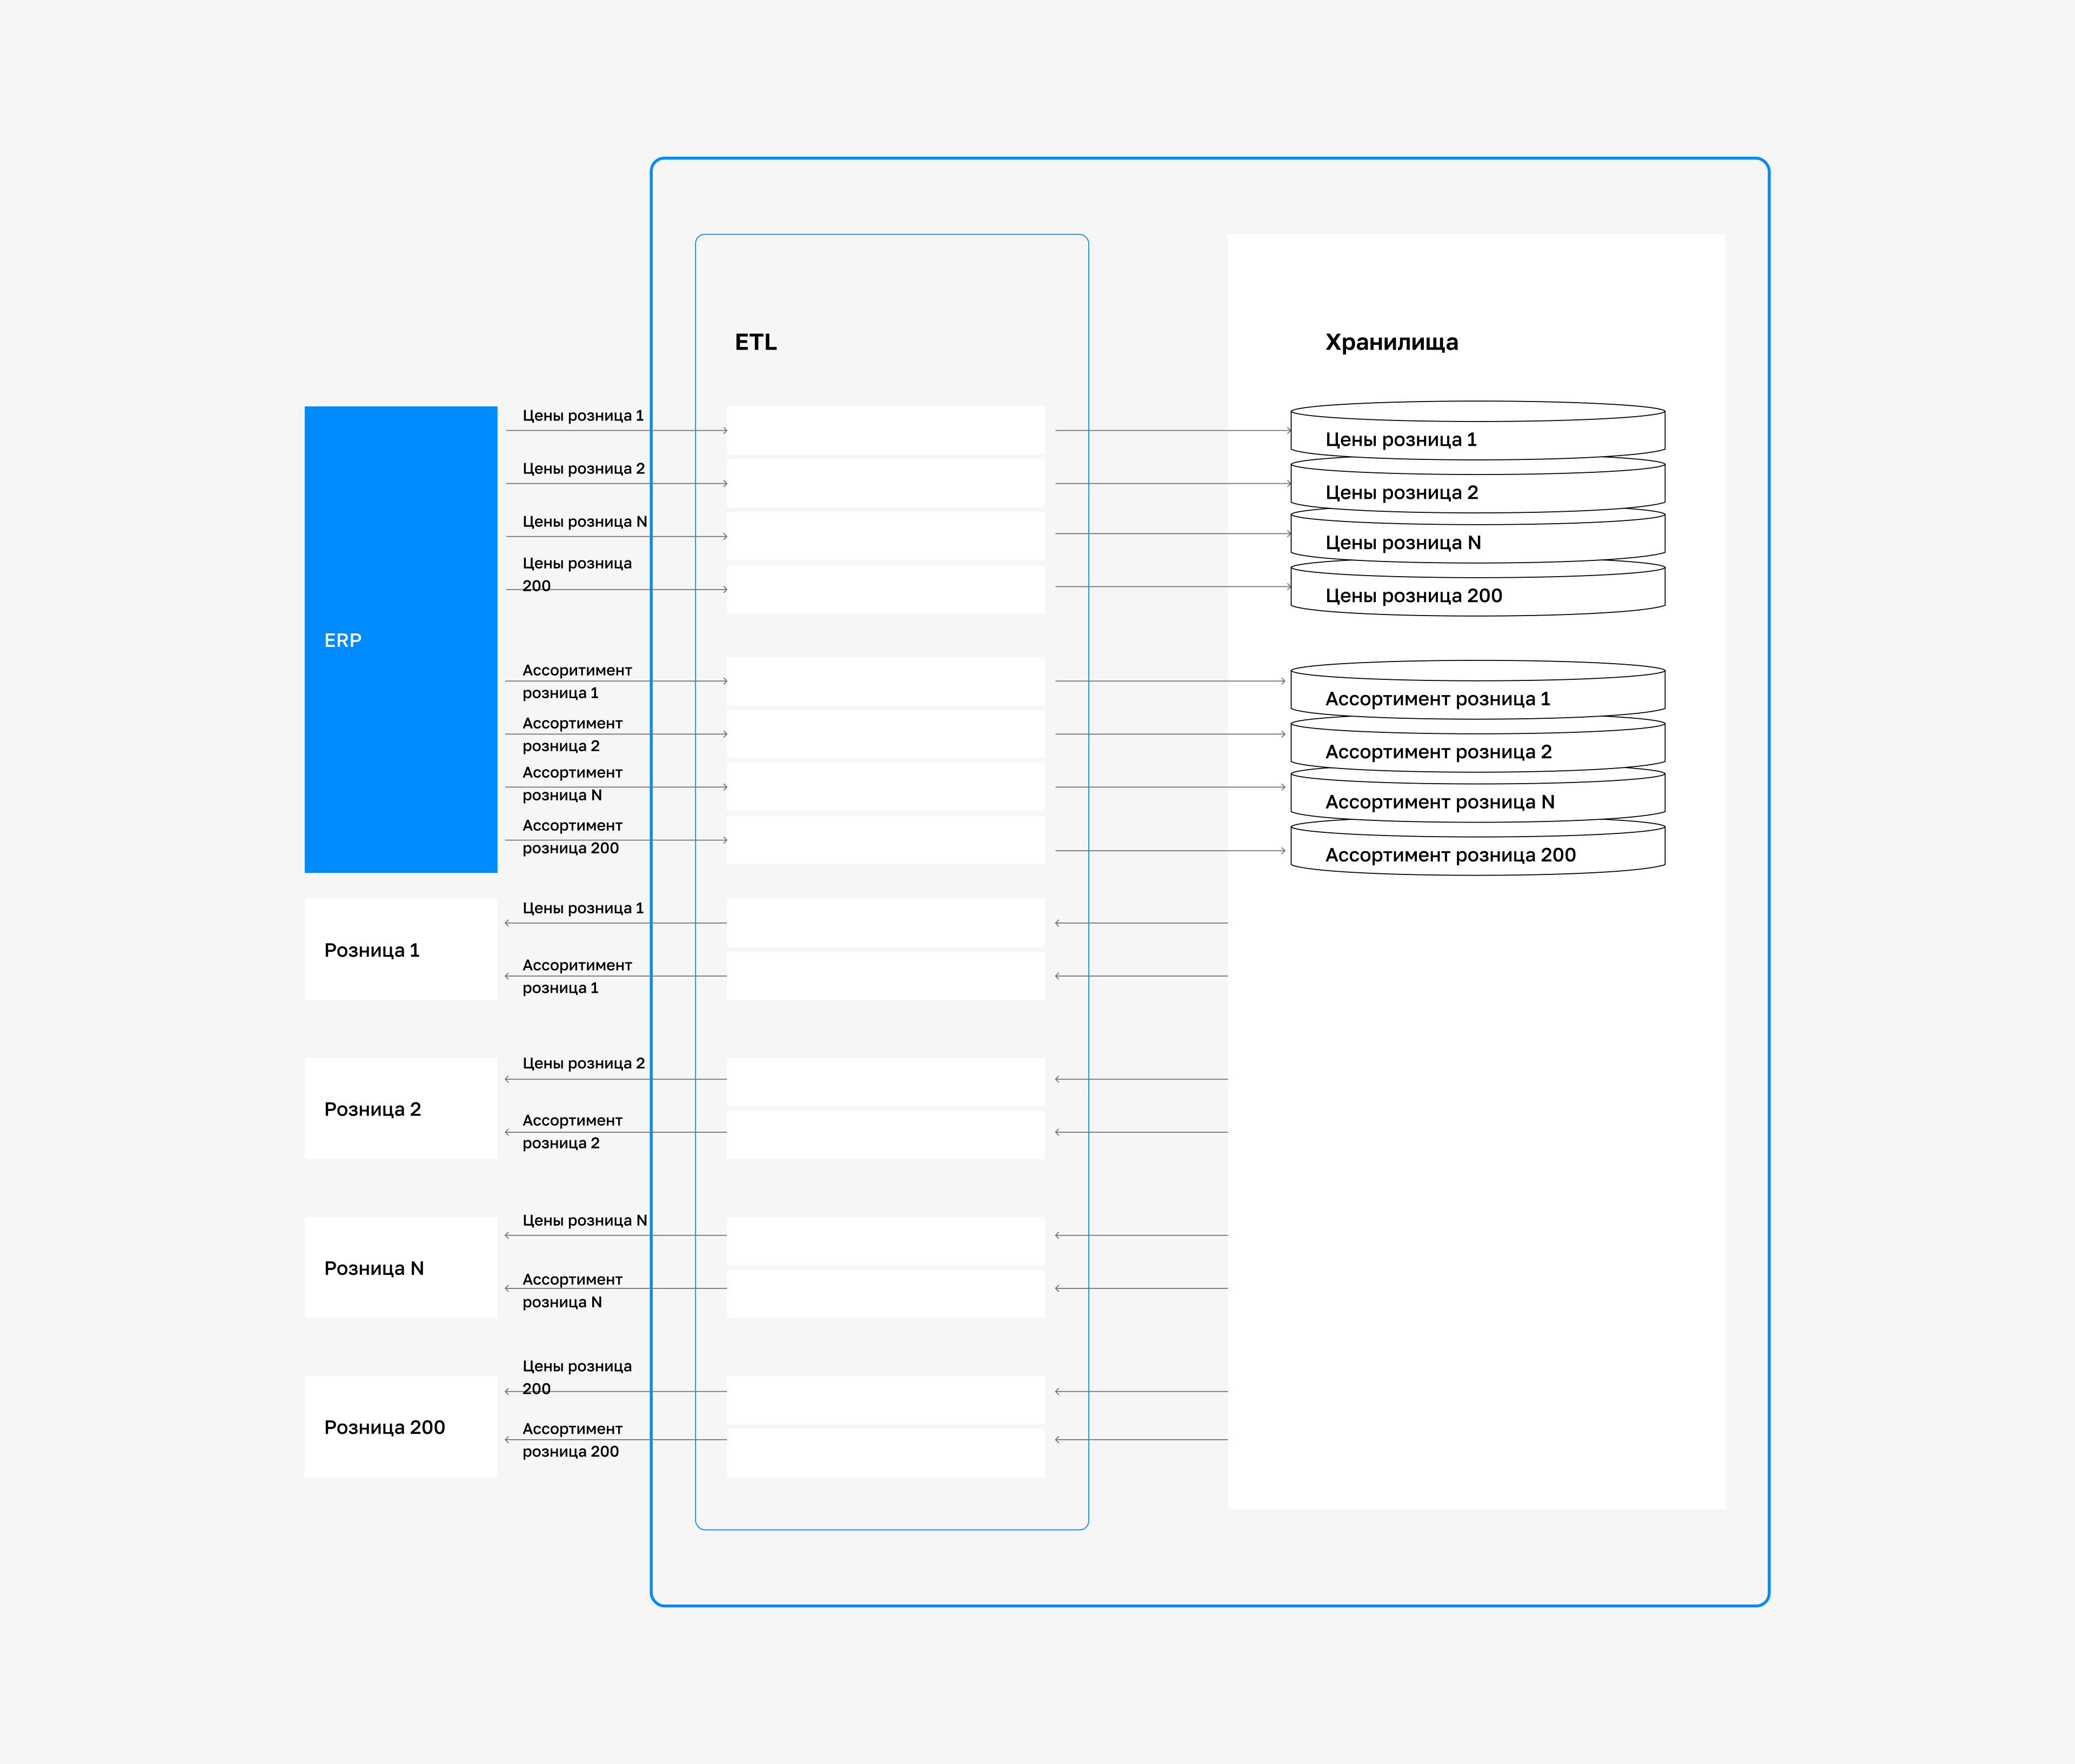
  3. The integration bus takes over the data exchange.

  4. The source sends data once in its preferred format; the bus stores messages, transforms them, and delivers them to recipients.

  5. Replacing or upgrading a system changes one adapter on the bus, not a cascade of pairwise integrations.

  6. This is loose coupling, which DORA links to delivery speed and stability.
What changes after bus implementation

Point to point

  • Every new system becomes a separate integration project with each neighbor
  • A developer tracks the error through logs from two systems
  • If one system fails, neighboring systems can fail in a cascade
  • Data in the systems contradicts itself

Through the bus

  • A new system connects to existing flows in a few days
  • A support operator isolates the error using bus monitoring
  • Systems are isolated: messages wait in a queue and are delivered after recovery
  • The bus keeps message history; lost messages can be restored without custom fixes

Integration layer between enterprise systems

Sources

1C / ERPAccounting, item master
CRM, WMScustomers, warehouse
Website, marketplacesorders, prices

Bus

Routing and transformationrecipient-specific format
Queues and redeliveryretry, idempotency
Monitoring and historyerror localization

Recipients

BI / DWHanalytics
Accounting and logistics1C, WMS, TMS
External platformsmarketplaces, partners
The source sends data once. The bus stores, transforms, and delivers it, and recipients do not know about each other.

We choose the tool for the task, not for the trend

We start by assessing the system landscape, workload, licensing requirements, and team expertise. Where KT.Team has a public case, we link to it; for n8n, to our analysis of use cases and limitations.

ToolWhen we choose itConstraintKT.Team experience
n8nLightweight processes and automation when launch in days mattersComplex logic requires JavaScript and engineering oversightn8n use cases and limitations
DatareonEnterprise environment with 1C, MDM, and master dataProprietary delivery: we include licenses and support in TCODeveloper case: Datareon integrations
Apache KafkaHigh-load event streams and asynchronous exchangeKafka is a message broker, not a complete ESB: routing, transformation, and monitoring must be built separatelyFurniture holding case study
MuleSoftAPI-led architecture and reusable APIs across a large system landscapeCommercial platform: we include Anypoint licenses and expertise in TCOFix Price: supplier portal
Talend ESBJobs and data transformations when integration logic is easier to assemble than build from scratchBefore scaling, we define the version, support model, and job ownersLogistics: integrations 4x faster
WSO2Open-source enterprise integration when you need API management alongside the busOpen source without vendor lock-in; higher entry barrier for the teamMarketplaces via WSO2

A detailed breakdown of licensing, community, and fault tolerance is in the article comparison of ESB solutions in the CIS market.

How we implement

  1. 01

    Pre-project assessment

    Map of systems and data flows (SOA diagram): what moves, from where to where, and where the business loses speed.

  2. 02

    Pilot flow

    The first flow on the chosen tool across three environments: test, preprod, production.

  3. 03

    Scaling

    Flows are copied and adapted for new systems; each connector gets up to three monitoring dashboards.

  4. 04

    Support handoff

    Documentation for copying and maintaining integrations; errors are handled by the operator, not the developer.

Map out your integration landscape

Loose coupling makes failures silent - that is why the bus is monitored separately

  1. Point-to-point integration fails loudly: if the exchange goes down, users see it the same hour. A bus works differently.

  2. The sender puts the message into the queue, gets an acknowledgment, and moves on - it no longer knows whether it reached the recipient.

  3. This is exactly the effect a bus is meant to deliver: systems stop depending on one another.

  4. The downside is that failures become silent.

  5. A message can get stuck in a queue, loop through redelivery, or be lost during transformation, and this is discovered not at the moment of failure but at the end-of-month reconciliation.

  6. Loose coupling is one of the two architectural factors that the DORA research links to high team performance.

  7. But it shifts failure detection from users to instrumentation.

  8. So observability for the bus is not an extra option but a requirement for operating it: without it, you get an architecture that changes quickly and is fixed slowly.

  9. We separate two questions that are usually mixed together.

  10. Monitoring answers "is it working or not" - these are predefined checks.

  11. Observability answers "why exactly this order did not get through"

  12. is the ability to ask the system a question nobody anticipated in advance. The first is covered by a dashboard, the second by an end-to-end identifier and message history.

What we take off the bus and what question it answers

System / layerScope of responsibility
Consumer lag and queue depth"Are we falling behind or already stuck?" A growing queue is the only early sign that the consumer is struggling, before the business sees the mismatch.
Error rate by route, not for the bus as a whole"Which exact flow is broken?" Overall bus availability of 99.9% says nothing to the order owner if their route is the one that is down.
End-to-end latency p95 and p99"Where is it really slow?" The average hides the tail: half of routes may finish in a second while one critical route takes a minute.
Dead letter queue (DLQ)"How many messages are stuck, and since when?" The DLQ separates a one-off consumer failure from a systematically invalid format.
End-to-end request identifier (correlation ID)"Where is order No. 12345 stuck?" One identifier passes through all systems and turns incident analysis from polling five teams into a single query.
Reprocessing result"Did it recover on its own or does it need manual intervention?" The share of successful retries shows where idempotency already works and where retries create duplicates.

Observability layer for the integration stack

Signal -> picture -> action

What we take off

Exchange logsmessage body and status, transformation error
Route metricslag, queue depth, error rate, p95/p99
Tracingcorrelation ID across all systems

What is visible

Route dashboardthe state of each flow, not the bus on average
DLQ and historywhat is stuck, when, and why
Threshold alertsto the flow owner, not to the group chat

What We Do

Localization in minutessearch by identifier instead of polling teams
Redeliveryreplay from history without developer involvement
Contract changeif the format keeps breaking systematically
The goal of the observability layer is not a pretty dashboard, but shorter recovery time (MTTR in DORA terms) and a verifiable flow-level promise: a target level and error budget from Google SRE practices.

We build integrations that

No data loss

The bus stores message history. Even if the target system did not accept a thousand messages, they can be restored without involving developers.

Maintained by an operator

A self-documenting low-code layer with built-in monitoring: the support operator isolates the issue by following the instructions.

Not tied to a vendor

The integration code is packaged as a standalone service (JAR or Docker image); the tool can be replaced without rewriting the setup.

Learn more

Cases

ESB implementation cases

Read all

Testimonials

Client feedback on integrations

All reviews

The KT.Team team is a mature development partner. The delivery process is very clearly organized, and the smooth collaboration within the engineering team deserves special mention. When the team sees that the development process needs fine-tuning, it does it. During discussions, the team digs into the essence of the tasks and seeks to understand the business context. The work is aimed not at formally fulfilling the specification but at solving the real problem. Thanks to strong engineering expertise and product thinking, the team can be trusted not only with implementation but also with the architecture of the entire system.

ESB/iPaaS Integration Cost Calculator Vadim MizhenskyHead of Digital Product Development, FSK Group

The Muztorg group of companies has been working successfully with the KT.Team team for more than two years. The high professionalism of our partners helps us a great deal, as does their ability to combine well-structured project management with minimal formal constraints. I would especially like to note the friendliness and openness of the KT.Team staff.

ESB/iPaaS Integration Cost Calculator Dmitry SavelievBoard Advisor on Digital Development, Muztorg

You set a high standard for working with contractors. After you, dealing with others leaves a feeling of falling short of expectations.

ESB/iPaaS Integration Cost Calculator Dmitry StolbovCEO, MechTech Ecosystem

Project estimation

We will calculate the timeline and cost of bus implementation

We start with a pre-project assessment: a map of systems and flows, the right tool for the task, and a pilot flow plan.

  • system and flow map
  • pilot flow in production
  • monitoring and documentation
Discuss a Project

Discuss the solution: ESB / iPaaS integration cost by...

Send via: