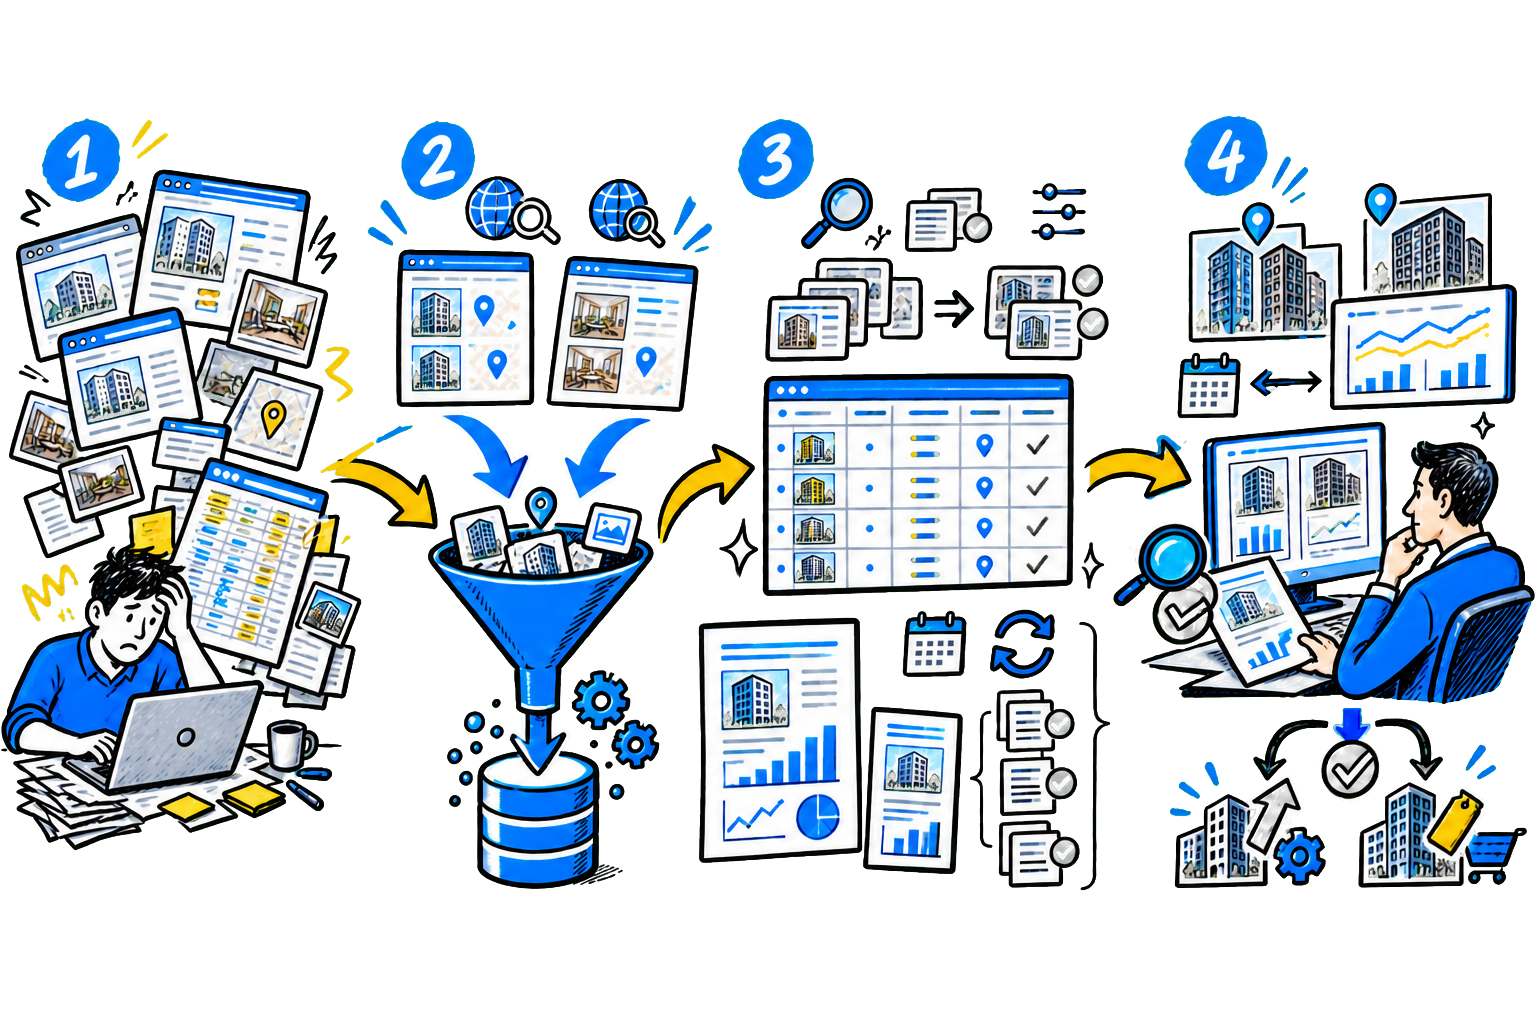
Construction analytics is needed to understand three things: where the money goes, where losses occur, and which projects are profitable. Let us look at five areas that deliver fast, measurable results. 1. Cost and unit cost analytics Here you calculate the actual project expenses: materials, equipment, wages, rent, logistics, and other items. For example, a company was running several sites at once and spent about 80 hours per month checking subcontractor acceptance reports.
Documentation errors delayed payment, and contractors paused work. After the organization improved data control, verification time decreased and downtime fell. How to apply cost and unit cost analytics: collect all costs in one place and compare plan versus actual. If expenses exceed the limit, the system should immediately show this to the responsible person. 2.
Schedule and progress analytics You track what is happening on site: which tasks are complete, where delays exist, and how they affect the whole project. If one stage slips, the others follow. Without analytics, you only learn about the problem after deadlines are missed. When a company connects the work schedule to actual data, the impact becomes visible immediately. For example, a delay at the foundation stage automatically shows how the handover date will shift.
This makes it possible to adjust the plan in advance instead of dealing with the consequences. 3. Financial analytics Here you monitor the money: cash flow, payments from clients, receivables, and budget performance. Without this kind of analytics, a company may look profitable on paper while still experiencing cash flow gaps. Example: a developer discovered that equipment fuel consumption was nearly 40% over budget. The cause was found quickly: the equipment was operating inefficiently.
After the adjustment, the company reduced costs and returned money to the project budget. The point is to spot such deviations immediately, not a month later in a report. 4. Sales analytics If a company sells apartments or properties, it is important to understand how the funnel works. Without analytics, it is not visible: - where leads come from; - where clients are lost; - how long managers spend handling inquiries. These metrics directly affect revenue.
Organizations that track these data find bottlenecks faster and increase sales without additional ad spend. 5. Safety and quality analytics Here you track incidents, violations, and rework. Simply recording problems does not produce results. It is important to see recurring causes. For example, in one company most violations turned out to be linked to a specific type of work.
After targeted training and process changes, the number of incidents dropped sharply and insurance costs decreased. Safety and quality analytics helps not only reduce risks but also cut losses from rework.
Discuss your challenge with an architect
What analytics gives to business When construction analytics covers all key areas, the company gains control. Management can see where costs are rising, which projects are slipping behind schedule, and where money is being lost. This makes it possible to make decisions faster and prevent issues from turning into losses. Important: if you implement analytics in only one area, the effect will be limited.
Maximum results come when data is connected: costs, timelines, finance, and sales. What construction analytics delivers by area:
| Area | What to Track | How this affects the business | Economic Impact |
|---|
| Resources and cost price | Comparison of planned and actual costs, material turnover,
equipment and labor utilization | Helps spot overruns in time and reduce unnecessary purchases
and not keep money tied up in inventory | Reduction in cost price of 5-15%,
release of working capital |
| Deadlines and work completion | Schedule compliance by stage, schedule deviations, delay causes | Helps quickly identify bottlenecks and reallocate resources,
to keep deadlines on track | Reduction in downtime of 20-30%,
fewer penalties and delays |
| Finance and budget | Cash flow, accounts receivable, and accounts payable,
budget deviations | Shows whether there is enough money for projects
and where cash gaps appear | Reduction in cash flow gaps of up to 40%,
control of actual profit |
| Sales | Conversion by stage, request handling speed,
lead sources | Shows where clients are lost
and which channels generate revenue | Revenue growth of 10-25%
without increasing the advertising budget |
| Safety and quality | Number of incidents, recurring violations,
defect resolution times | Helps reduce the number of incidents and rework
through targeted work on problems | Reduction in insurance payouts of 15-30%,
lower costs for fixing errors |