










BI in construction - budget, schedule, and construction control in one system

Power BI in construction: visualize construction progress, deviation reports, a KPI panel for site control. Unified analytics across sites and plots.

Our clients

Clients and partners

Capital Group
FSK Group
SMLT
Tochno
Dogma
Sber City
FM Logistic
Danone
+10clients · View cases →

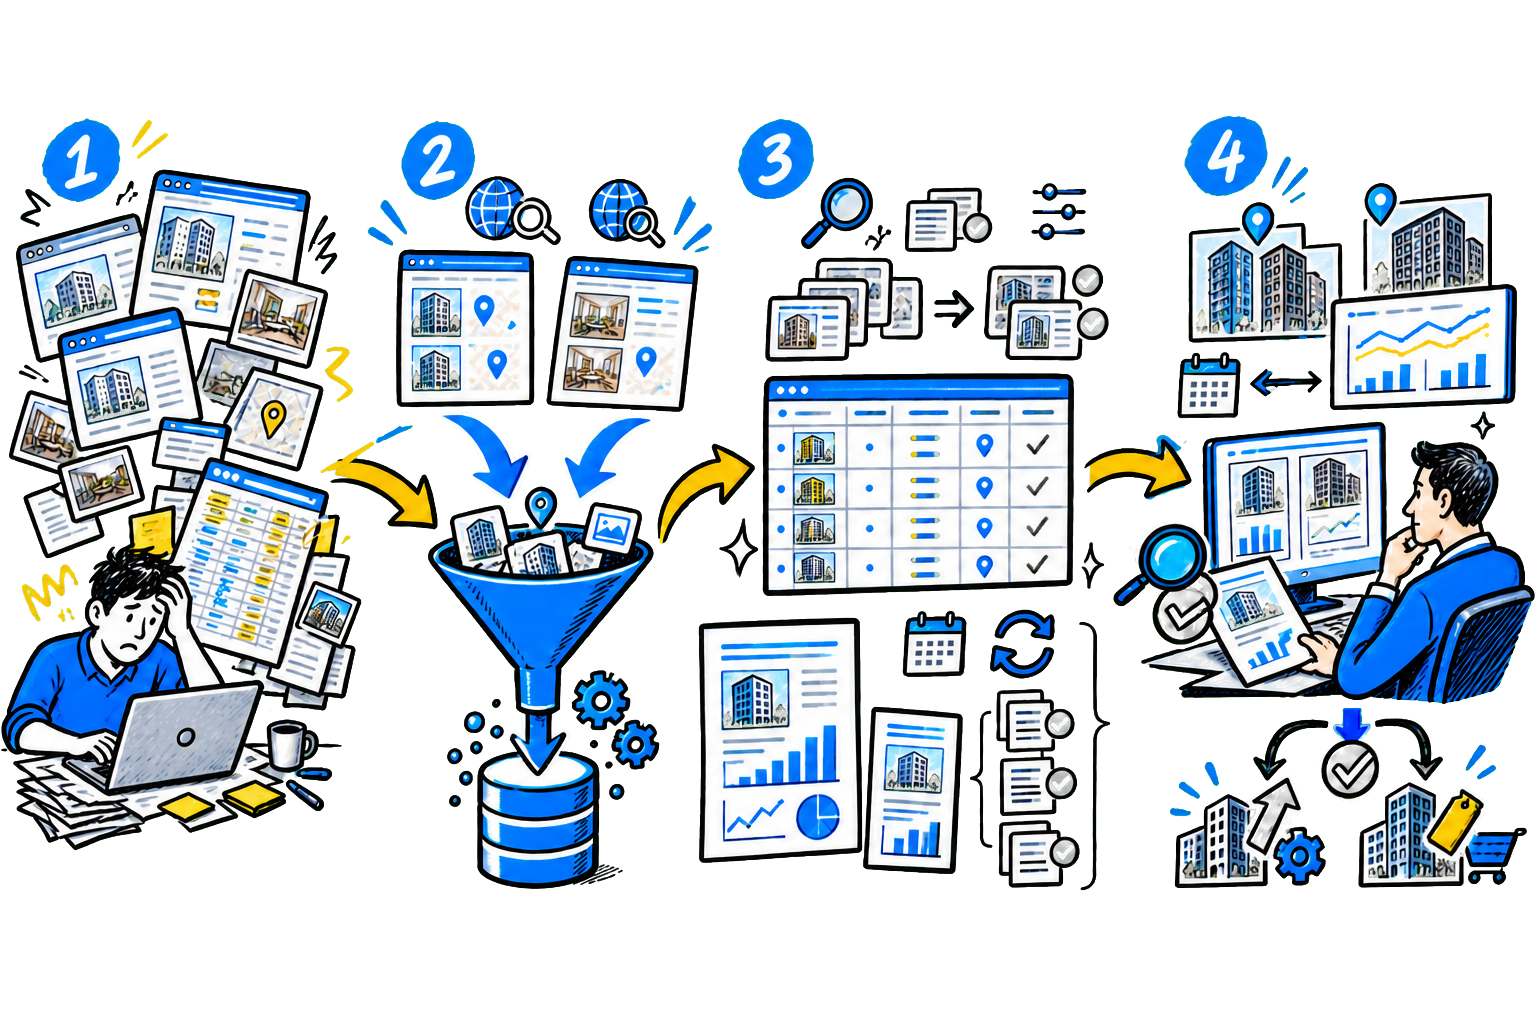
A single BI platform unifies data from construction control, budgets, schedules, and contractor systems. Get up-to-date reports, KPIs, and Power BI visuals for construction progress - without Excel or manual summaries. We solve the core needs of the developer, general contractor, and investor

Why a BI platform turns construction from data chaos into a manageable system

  1. A single BI information space brings together schedules, budgets, and construction control.

  2. All metrics are synchronized in one view, eliminating manual summaries and discrepancies between departments.

  3. Power BI visualizes construction progress and shows trends across sites, work zones, and contractors.

  4. Managers see actual execution rates and bottlenecks on interactive dashboards.

  5. The system automatically generates reports on delays, overruns, and schedule deviations, enabling construction control based on forecast rather than after-the-fact results. KPI dashboard for construction control

  6. We build custom KPI dashboards for control teams and management: schedule compliance, budget execution, issue closure, and contractor performance.

Assess where AI can deliver impact in your process

Efficiency and growth in one solution

Construction projects involve dozens of spreadsheets, contractors, and reports

Without a unified BI tool, data gets fragmented, schedules lose relevance, and managers see the consequences, not the causes, of issues. A BI platform brings together budget, schedule, and construction control, delivering actionable analytics across all sites in one place. The solution includes:


We integrate data from ERP, construction control systems, and schedules into Power BI.

We configure dashboards for executives, analysts, and control teams.

We generate automated deviation and KPI reports without manual input. The business result:

A single source of truth across all construction sites.

Real-time tracking of schedule and cost deviations.

Improved accuracy of management decisions and execution transparency. Solutions without unnecessary complexity from idea and analysis to results

We will study your processes and propose a ready-to-use implementation plan

  1. We consult We discuss goals and tasks, define priorities, and set expected outcomes for the joint work

  2. We analyze your processes We study current processes and approaches, identify growth points, and determine which solution will deliver tangible results

  3. We plan the solution rollout We discuss goals and tasks, define priorities, and set expected outcomes for the joint work

  4. Launch and support We implement the solution, train your team and provide support so the solution delivers tangible value

How analytics improves project control and reduces risk

Implementing BI in construction companies delivers measurable results within the first months: greater transparency, lower risk, and faster decision-making at every level. 60% less time spent preparing reports 30% fewer schedule delays through deviation analysis 25% budget savings through control of actual costs 100% transparency of execution across all sites and contractors Customer feedback

Discuss: BI in construction - budget, schedule, and...

Send via: