Queue-Free IT Analytics: The Datacor Case

Datacor delivered queue-free rental analytics without IT bottlenecks; we explain why the data model matters more than the dashboard.

  • Where Rental Revenue Is Lost
  • The same challenge in other industries
  • How Self-Service Analytics Works
  • Where These Projects Break Down

Trigger

  1. Datacor develops software for industrial gas distributors.

  2. Company reported on the AWS blog, how it gave users of its TrackAbout product self-service rental analytics in Amazon Quick Sight.

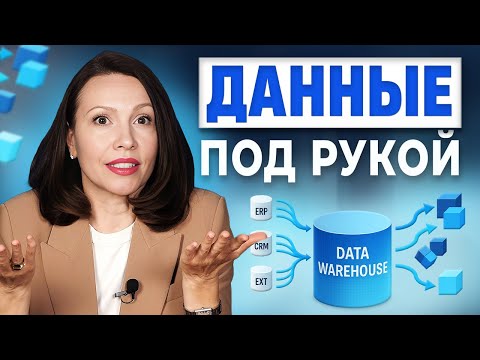
  3. The main work was completed before the dashboard appeared: asset data was consolidated from disparate systems into one model.

  4. Without such a model, any BI tool answers an executive's question at the same speed as an analyst whose request is waiting in a queue.


Where Rental Revenue Is Lost

  1. For welding and industrial gas distributors, equipment rentals account for a significant share of revenue: cylinders, cylinder packs, and stationary tanks.

  2. The cylinder is sent to the customer, and rental charges begin accruing from that day.

  3. If a cylinder sits unused at a customer's site for months and no invoice is issued for it, the company loses money, and no system reports the error.

  4. To manage such a fleet, the owner needs answers to three questions.

  5. What share of the fleet is actually in use by customers?

  6. Where is the actual rate below the price list, and why?

  7. How much accrued rent did the company fail to collect?

  8. According to Datacor, before the project, the data needed for these answers was stored in disconnected systems and could only be obtained through IT. The reports IT managed to compile provided a limited view of fleet utilization, rate compliance, and revenue recovery.

The same challenge in other industries

Replace cylinders with pallets, coffee machines, special-purpose vehicles, or retail equipment, and you have a typical mid-sized company. Contracts and rates are managed in 1C, asset movements in a WMS or logistics spreadsheets, and customers in a CRM. The sales director asks a question, an analyst spends a week consolidating exports, and by the time the answer arrives, the situation has already changed.

We evaluate any tool through TTU, time to use: the time from asking a question to making a data-driven decision. In the “IT request → export → Excel” process

TTU is measured in weeks

Ultimately, the executive makes a decision based on intuition: the figures arrive after the problem has either resolved itself or become more expensive.

How Self-Service Analytics Works

For users, self-service BI is simple: they open a dashboard or ask a question in everyday language and receive a chart.

Three layers underpin this, and each requires engineering work.

Unified data model. The asset, customer, contract, rate, and movement are defined once and linked by keys. Datacor had an advantage here: TrackAbout has recorded the movement of every cylinder by scanning from the outset, so the asset's digital history already existed.

Most companies have to build this layer from scratch. Semantic layer.

This is where metric definitions are established.

Is utilization the number of days with the customer divided by the number of days in the fleet, or is another formula used? Are cylinders undergoing repair included?

As long as finance and sales calculate the same metric differently, a dashboard meeting turns into an argument over whose number is correct. Interface.

Ready-made dashboards, filters, and natural-language questions that Quick Sight converts into data queries.

The user sees only this layer.

In our experience, it accounts for a smaller share of the project budget.

Map out your integration landscape

Where These Projects Break Down

  1. A typical scenario: a company buys a BI license and immediately builds dashboards on top of raw exports.

  2. Three months later, finance, sales, and logistics present four different revenue figures at a meeting, and the director calls the analyst again to find out which one to trust.

  3. The second common mistake is point-to-point integration.

  4. Each system exports data to BI using its own script.

  5. An 1C developer renames a field, the report stops calculating, and the team discovers it in a meeting where the figures do not match.

  6. The third mistake arrived with generative AI.

  7. A language model working on dirty data responds confidently, quickly, and incorrectly. A manager who receives an incorrect accounts receivable figure from a chatbot and makes a decision based on it will not use the tool again.

How We Build This Architecture

At KT.Team, our projects start with data and end with the interface. An integration bus based on Datareon, Apache Kafka, or Talend ESB collects events from 1C, warehouse, and accounting systems and brings them into a shared model. If a

Source

  1. A field changes, one connector fails with a clear error, and reports continue to run on the latest valid data.

  2. On top of the model, we define a metric dictionary: formulas, owners, and permitted values. The dictionary is needed by both people and AI.

  3. When we add natural-language questions, the model (GigaChat, YandexGPT, or Claude, depending on the architecture requirements) receives metric definitions through RAG and uses MCP to read only prepared data marts. It has no access to raw tables.

  4. All queries pass through the LLM & Security Gateway, making it possible to see who asked what and which data was sent to the model. In this architecture, an AI assistant for analytics is the final and relatively inexpensive step.

  5. Most of the work goes into the data model and metric dictionary.

Conclusion

The BI tool occupies only a small part of the Datacor case. The key point is that the company first organized its asset data and only then made it available to decision-makers. TrackAbout users get answers in minutes because engineers had already linked scans, contracts, and rates in one model. Companies that skip this work and start with a dashboard pay for a license and still wait weeks for reports from IT.

Source

Datacor, Amazon Web Services: How Datacor built self-service rental analytics with Amazon Quick Sight, AWS Machine Learning Blog.

Discuss the article: Analytics Without an IT Queue: What It Shows…

Enter your email or phone number so we can get back to you.

Send via: