












Client: a developer from Orenburg
"Stroytekhservis" has been building housing in Orenburg since 1999. The developer's public profile lists 19 completed buildings and 6 more under construction.
To make decisions about product, pricing, and positioning, the team needs regular snapshots of competitors' offerings: properties, residential complexes, floor plans, sizes, and prices.

Problem: the market snapshot took up to 5 business days to collect
Before the project, data was gathered manually from Avito, CIAN, Domclick, nash.dom.rf, and developers' websites. The results were transferred into screenshots, Word, and Excel, and intermediate versions were sent by email.
One analysis cycle took up to five business days. As a result, the snapshot was usually updated once a month: by the time of discussion, some listings and prices could already have changed, and repeating the sample with the same rules was difficult.
- data from different sources used different fields and presentation formats;
- the same properties had to be matched manually;
- the full table was useful for analysts but inconvenient for quick executive review;
- run history and unified sampling rules were not stored in one place.
Why monitoring regularity became critical
The new-build market changes faster than a monthly reporting cycle. According to the Bank of CIS, in Q1 2026 housing sales under equity participation agreements rose 12% year over year, primary market prices increased 3.9% quarter over quarter, and new project launches in January-April grew 18% year over year.
At the same time, a simple comparison of average prices can be misleading. The Bank of CIS separately notes that proper comparison requires accounting for property characteristics, including the year built, housing class, and apartment size. For a developer, this turns data normalization from a technical task into a condition for a sound market decision.
Goal: make monitoring repeatable
The goal was to give economists, marketing, sales, and executives one clear workflow: set monitoring parameters, get comparable data, and return to any previous run.
We deliberately did not start with a heavy data warehouse or a universal BI platform. For the first useful version, it was more important to shorten the path from request to finished snapshot and verify which parameters are actually used in practice.
Solution: the user launches monitoring themselves
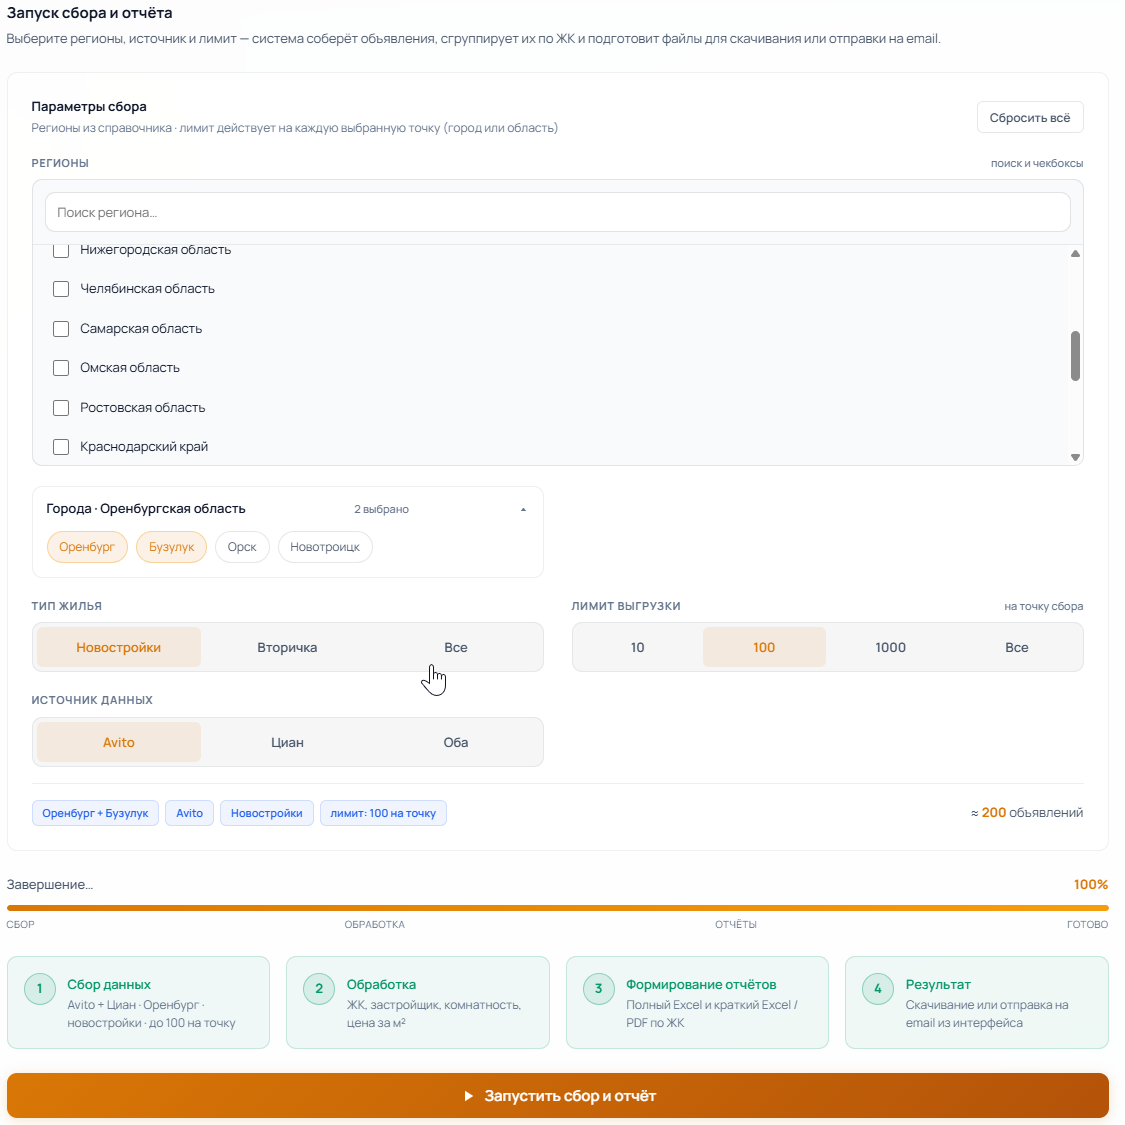
In the web interface, the user selects the region and cities, housing type, sources, and export limit. After launch, the screen shows the processing stages, from collection to report generation.
This turned a one-off request to an analyst into a repeatable operation with fixed parameters.
How collection and normalization were set up
The service collects listings from Avito and CIAN based on the specified parameters, normalizes the fields into a common structure, removes duplicates, and groups listings by residential complex. The report preserves the attributes needed to compare properties.
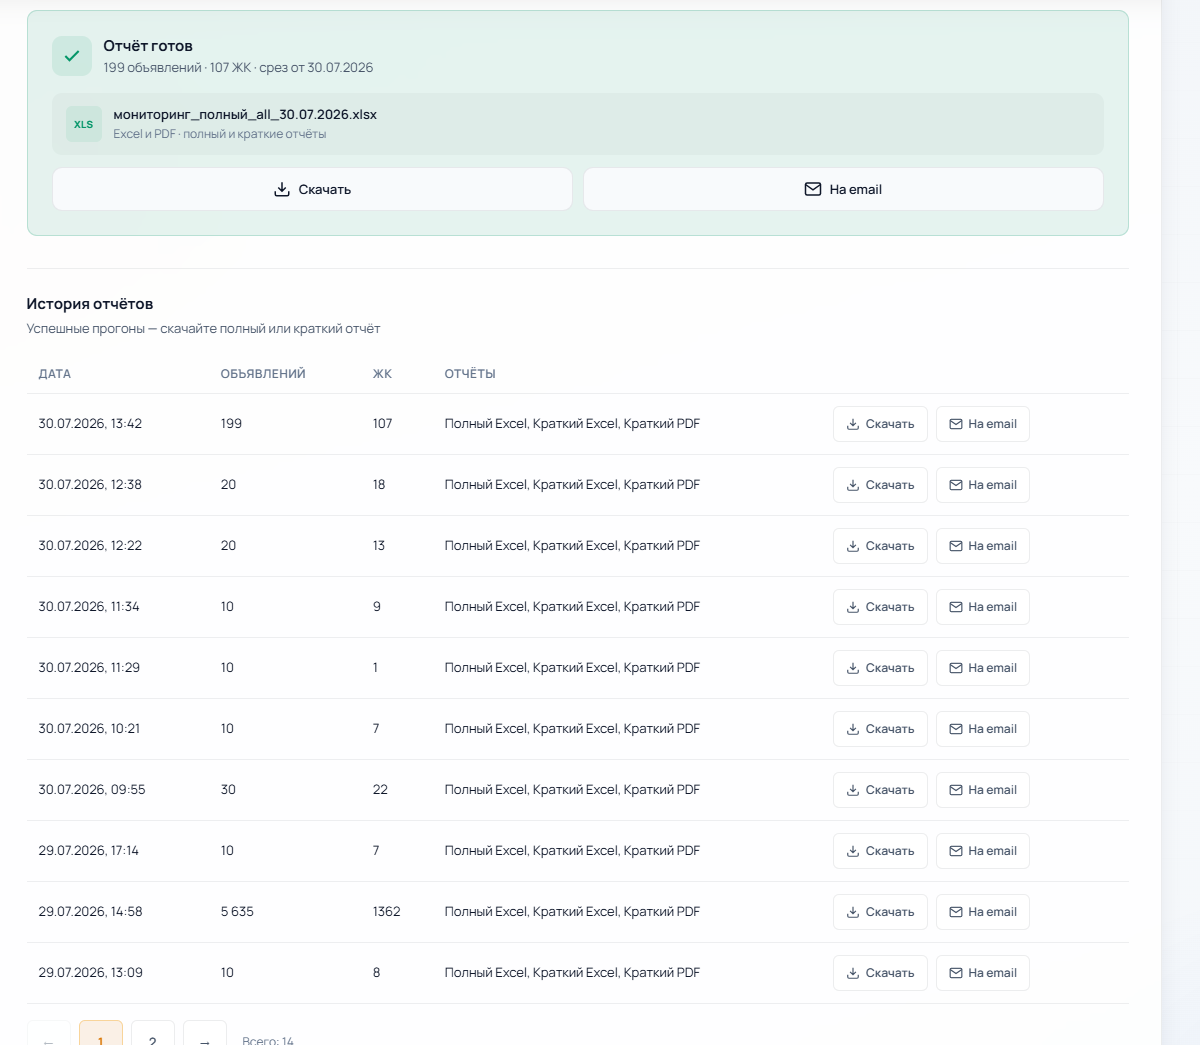
The output consists of three files: a full table for detailed work, a short Excel version, and a concise PDF for quick review. Reports can be downloaded from history or received by email.
- collection is launched on demand and does not require maintaining an extra data pool in advance;
- full and short formats serve different management scenarios;
- the parameters and results of each run are saved for repeat analysis.
Review a similar project with an architect
Result 1: market snapshot from 3,000+ listings
In one confirmed run, the service collected more than 3,000 listings and identified more than 107 unique residential complexes. Instead of a set of disconnected files, the team received a single dataset with a consistent structure.
This is the actual result of a working process. Estimates of future time savings and financial impact are not included in the result: they still need to be measured in regular use.
Result 2: more than 20 saved runs
The service history contains more than 20 successful runs. For each one, you can see the date, parameters, volume of collected data, and links to the generated reports.
Now a new snapshot does not start with searching email for the previous version: the team can return to an earlier run and use it as a baseline for comparison.
What changed for the business
In two months, the project reached a working service and its first confirmed runs. The main change was that monitoring became a standalone, repeatable process rather than a one-off manual effort by an analyst.
- the snapshot can be launched on demand, without waiting for the next monthly cycle;
- the fields and sampling rules are the same for all runs;
- analysts receive the full dataset, executives get a brief report;
- the accumulated history creates a basis for comparing periods.
What to measure next
Before automation, preparing a market snapshot took up to five business days. The next step is to measure the actual time from launch to management decision, the monitoring frequency, the share of manual corrections, and sample completeness across a series of regular runs.
This will let the project demonstrate not only technical feasibility, but also its impact on the speed of product, pricing, and marketing decisions.
Next step: dynamic analytics
Once run history has accumulated, the service can be expanded with period comparisons: tracking changes in prices, exposure time, and offer composition across residential complexes, as well as automatically highlighting significant deviations.
This will make monitoring not just a source of files, but a tool for regular management oversight of the market.
Sources
Bank of CIS. Financial Stability Review for Q4 2025 - Q1 2026: https://www.cbr.ru/analytics/finstab/ofs/4q_2025_1q_2026/
Bank of CIS. Assessment of the price gap between new-build and secondary housing: https://www.cbr.ru/press/event/?id=32662
CIAN. Public developer profile for Stroytekhservis: https://orenburg.cian.ru/zastroishchik-stroitekhservis-orenburg-12151/