Development project dashboards - sales, construction, and budget in BI

Unified BI dashboards for sales, construction, budget and marketing to control deviations and run plan-vs-actual project analysis.

Our clients

Clients and partners

Capital Group
FSK Group
SMLT
Tochno
Dogma
Sber City
FM Logistic
Danone
+10clients · View cases →

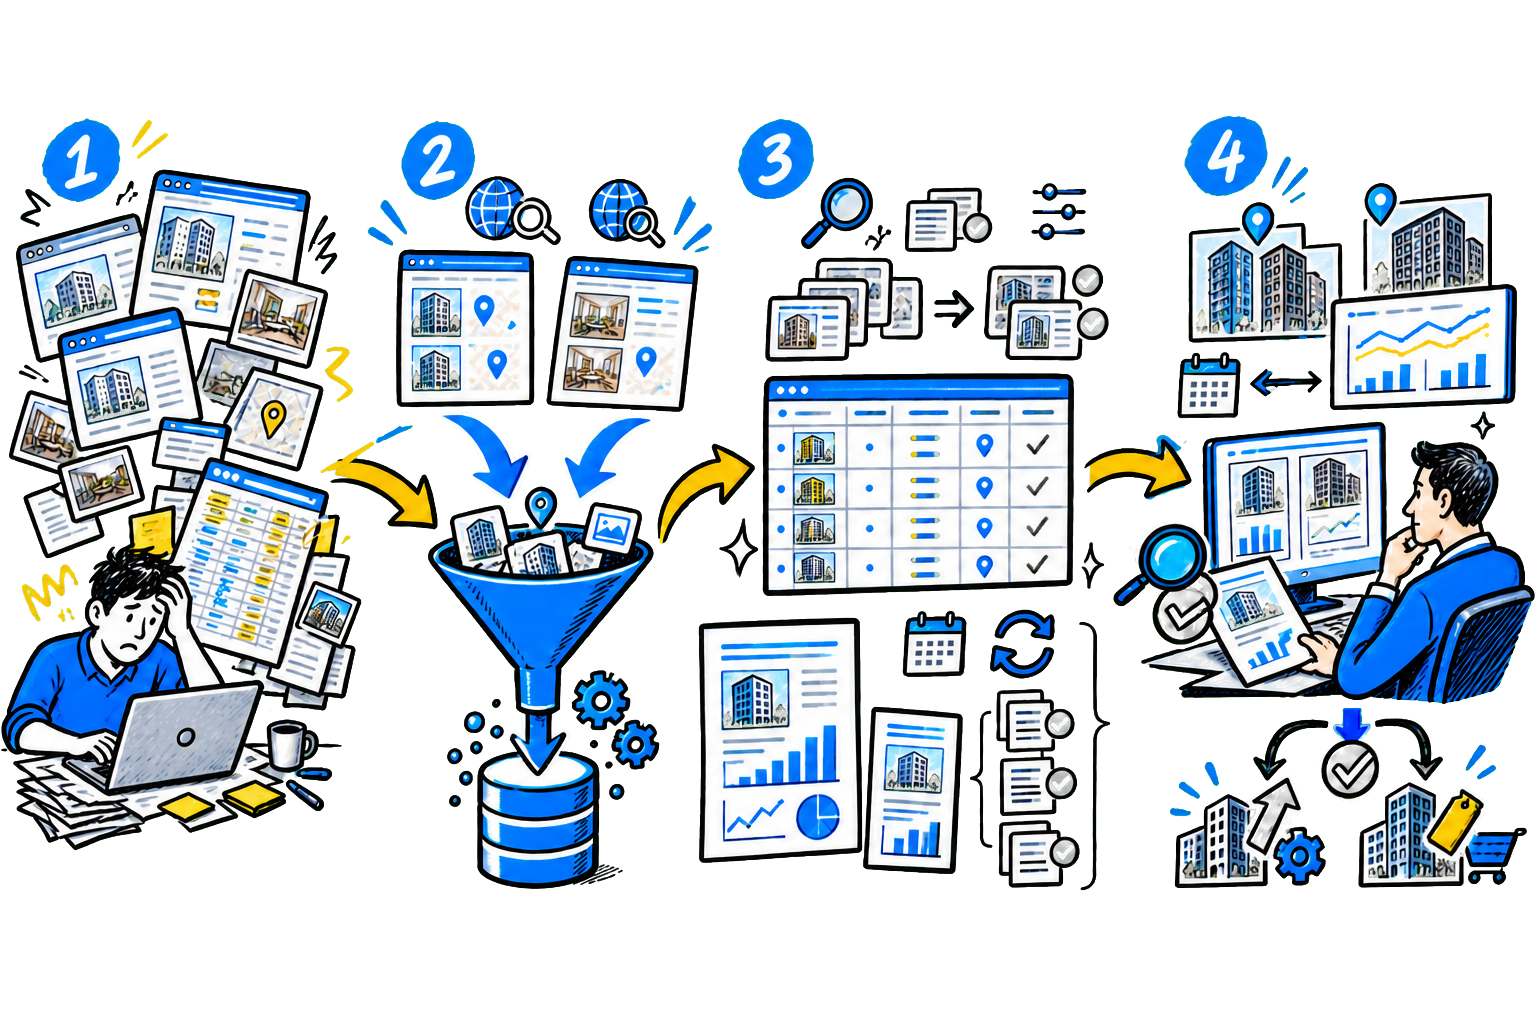
BI dashboards bring together sales, marketing, budget, and construction data in one system.

Show plan vs. actual, risks, deviations, DDU trends, work schedule, and financial model forecast.

Project management becomes transparent and responsive.

Unified analytics for construction, sales, budget, and marketing

Why BI dashboards improve control over development projects

  1. Show reservations, DDU, revenue, average price per square meter, sales trends by building, manager performance, and a plan fulfillment forecast.

  2. Construction dashboards and work schedule

  3. Show stage completion, plan vs. actual by work type, contractor delays, the impact of delays on commissioning, and the link to sales timelines.

  4. Financial and budget dashboards. Budget plan vs. actual, payments, escrow, cash gaps, payback, forecasts, and financial model execution.

  5. Lead cost, UTM analytics, channel KPIs, traffic, conversions, sales team workload, lead flow forecast, and required media budget.

Assess where AI can deliver impact in your process

Efficiency and growth in one solution

  1. We create a set of BI dashboards that brings together all sources: sales, traffic, equity participation agreements, construction, budget, payments, contractors, and escrow. The system automatically calculates variances and builds forecasts for timelines, costs, and revenue. The solution includes:

  2. Integration with CRM, ERP, accounting, construction control, and ad accounts.

  3. Dashboards for sales, marketing, construction, finance, and contractors.

  4. Plan-vs-actual analysis, variances, and financial forecasts. Business outcome:

  5. A single version of data for each residential complex, phase, and building.

  6. Rapidly identify risks in deadlines, sales, and budget.

  7. Manage the project based on facts, not Excel summaries. Decisions without unnecessary complexity, from idea and analysis to results.


We will study your processes and propose a ready-to-use implementation plan

We consult We discuss goals and tasks, define priorities, and set expected outcomes for the joint work

We analyze your processes We study current processes and approaches, identify growth points, and determine which solution will deliver tangible results

We plan the solution rollout We discuss goals and tasks, define priorities, and set expected outcomes for the joint work

Launch and support We implement the solution, train your team and provide support so the solution delivers tangible value

Faster management and transparent data

Dashboards help developers make faster, more accurate decisions, reducing risk and improving project predictability. 7x faster project reporting 90% fewer data errors through automation 50% lower cash gap risk 100% visibility into construction, sales, and budget status Client reviews

Discuss: Development project dashboards - sales,...

Send via: